In the Historical Analysis Page each time series definition consists of a underlying data set, i.e., an underlying and its parameter and, if relevant, its parameter definition. Similarly, each formula also consists of a data set—the result of the formula on each day.
Once you have defined one or more time series and, optionally, formulas, you can see statistical values for each data set in all the time series and formulas that are defined in the Historical Analysis page. So, for example, if you have defined a time series for the USD/JPY 1m forward rates and the USD/JPY 2m forward rates, you will see the statistics for both those data sets.
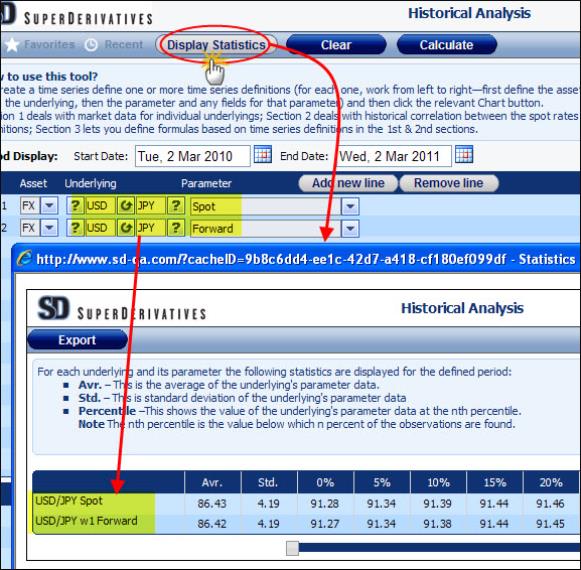
You see the statistical data information in the Statistics window. This window is accessed by clicking the Display Statistics button as seen in Figure 1.
Figure 1: Displaying Statistics
The statistical data is displayed for the period defined in the main Historical Analysis window. A line is included for each data set in all the time series and formulas defined in the main Historical Analysis page, regardless of whether or not you have checked those lines.
The following statistics are displayed for the defined period:
Avr.
This is the average of the underlying's parameter data.
Std.
This is standard deviation of the underlying's parameter data.
Percentile
This shows the value of the underlying's parameter data at the nth percentile.
The nth percentile is the value below which n percent of the observations are found.
To access the statistical data for each time series and formula:
In the Historical Analysis page click the Display Statistics button. The Statistics window opens with a line of data for each time series and formula in the main Historical Analysis window.