After having specified one or more time series and, optionally, formulas based on these time series, you can then instruct the system to display:
The value of each time series and formula as of the current date.
This value is shown in the Today's Results area | Current Value column.
The % of values in each time series and formula for the defined period that are below the value displayed in the Current Value column.
This result is shown in the Today's Results area | Likelihood column.
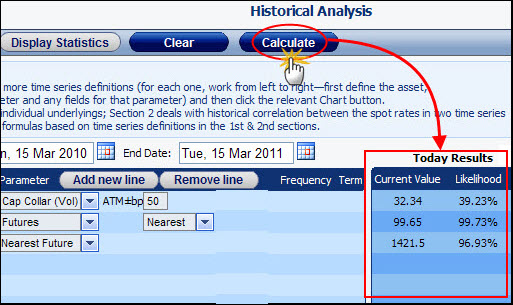
These results (as shown in Figure 1) are calculated for each time series and formula defined in the Historical Analysis page, regardless of whether or not you have checked those time series and formulas, (provided that adequate data is available).
Figure 1: Calculating Current Value & Likelihood Results for Time Series and Formulas
To display the Current Value and Likelihood results:
In the Historical Analysis page click the Calculate button. The results are displayed for each time series and formula.