The Greeks Display tool lets you easily look at the total risk for any portfolio–whether bucketed across the relevant contracts or tenors, or per expiry date, thereby providing you with a valuable risk management tool.
It does this by letting you aggregate multiple assets, each of which may be traded in a different unit from the other assets, into a single group. You do this by linking each of the relevant assets (i.e., the ones for which you want to see the results as a total) to a single benchmark asset.
Once you have done this, those linked assets form a group which is named after that selected benchmark asset. The purpose of this group is to let the system present the results for all the linked assets, which are usually based on different units, in a single unit, which is necessarily the native unit of the benchmark asset. To do this the system converts the results for each asset from its native unit to the benchmark asset's unit, using the relevant conversion factor between the individual asset and the benchmark asset.
Subsequently, when you then select this group in the Greeks Display window, you can then toggle between seeing the results for each of the individual assets in its own native unit or in the benchmark asset's unit. If you choose the latter option, you can of course then see the total across all the assets, as all the results are in the same unit.
Why is this useful? This is useful because being able to see the risk for any asset in a different unit from its native unit means that:
You can see the total risk across a group of assets, even for a result that is displayed in units, such as delta and gamma.
You can display the risk for any asset in a unit that you are familiar with, even if that unit is not native to that asset.
Accordingly, the Greeks Display window—together with the Risk Matrix tool—provides you with comprehensive commodity risk management.
However, when managing a strategy, it is not enough to hedge your commodity risk—you also need to hedge your FX risk and your interest rate risk. For example, if your home currency is GBP and you enter into a 5Y forward on Brent Crude Oil which is deep in the money, then you are not only exposed to the FX risk between your home currency (GBP) and the base currency (USD), but you are also exposed to the interest rate due to future cash flows.
Therefore, at the bottom of the Greeks Display window you can also see the following 3 risk elements for the entire strategy:
The Present Value result
This result is the price of the strategy as calculated using SD’s model if it was to be sold right now under current market conditions.
As this result is displayed in the base currency, it displays your FX risk against your home currency.
The Rho result, which displays the change in the strategy's value in relation to changes in interest rates for the base currency. Accordingly it displays your interest rate risk.
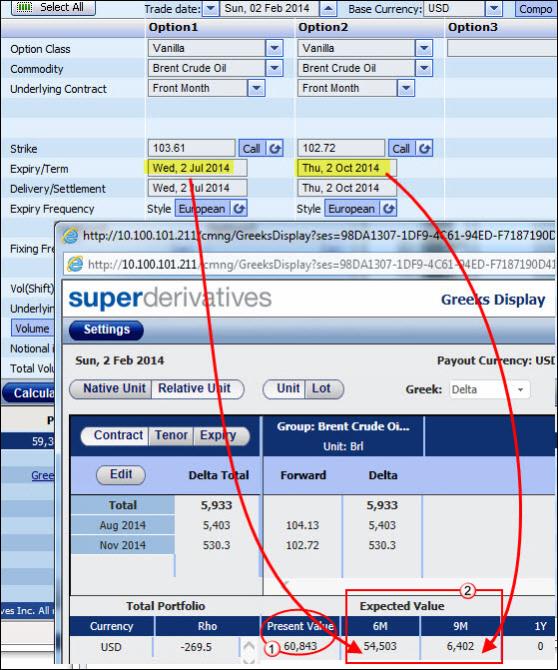
The Expected Value result
This result is the projected present value on the expiry dates of the respective instruments, with the calculations being made on the assumption that the market data (including the interest rates) will not change.
This result is displayed across the relevant buckets-in each bucket you see the expected value for all instruments due to expire up to that date. The first bucket includes the results for all instruments that are due to expire between the trade date and this date; for each other bucket, the result is the expected value of all instruments that are due to expire in the period between the previous bucket and this bucket. An example of this can be seen in Figure 1 below.
| Figure 1: | Seeing the Interest Rate Risk Due to Future Cash Flow |
For an overview of how the Greeks Display tool works (including controlling what is displayed, managing the groups of assets, and choosing the display mode), click Working with the Greeks Display Tool.
However, note that:
Currently the following instruments are only supported in the Greeks Display window in the expiry display mode:
TARN instruments
Basket and quanto basket
Best of
Worst of
Compound Asian strip and compound Asian strip collar (only the delta, delta cash and vega results are displayed)
So if your strategy does contain one or more of these instruments, when you load the strategy to the Greeks Display window a message pops up to let you know that only the expiry display mode will be enabled.
The gas formula and gas formula strip is supported in the Greeks Display window for all three display modes, but only the delta and delta cash results are displayed.
The accumulator and decumulator is supported in the Greeks Display window for all three display modes, but the gamma cash result is only displayed in the contract and tenor display modes, not in the expiry display mode.
What is the advantage of this window over the Portfolio page?
If you price a portfolio with multiple assets in the Portfolio page, although you can see all of the relevant results per instrument (as seen at 1 in See "Viewing the Greek Results in the Portfolio page "), any results that are displayed in units–such as delta or gamma–are not included in the column that displays the total for the results across the entire portfolio (as seen at 2 in See "Viewing the Greek Results in the Portfolio page "). This is because the units themselves are different across the various asset classes.
In addition, for any instrument you can only see the results for its asset's unit, that is, you cannot convert the results into a different unit which you may want to do, for example, in order to compare it with the results of another instrument.
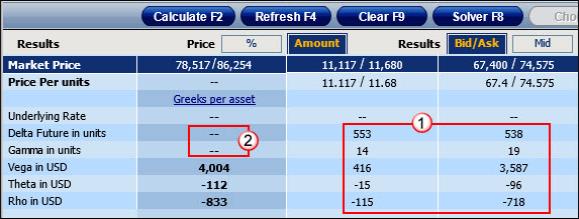
Figure 2: Viewing the Greek Results in the Portfolio page
Working with the Greeks Display Tool
After first defining a strategy in either pricing page and calculating it (as seen at 1 in See "The Greeks Display Window "), you then load it to the Greeks Display window by clicking the Greeks Display button in the Trader tab or the Structurer tab on the ribbon bar (as seen at 2 in See "The Greeks Display Window ").
By default, when you load a strategy to the Greeks Display window, each asset in the original strategy is automatically linked to itself (so for example, the Brent Crude Oil asset is linked to the Brent Crude Oil benchmark asset, the Gas Oil asset is linked to the Gas Oil benchmark asset, etc.), and is therefore displayed in its own group (as seen at 3 in See "The Greeks Display Window ").

Figure 3: The Greeks Display Window
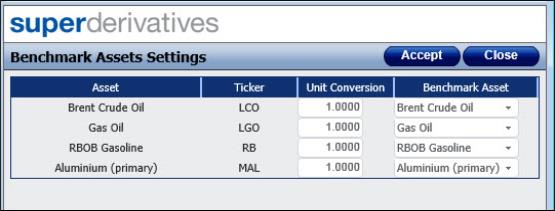
To see the aggregated results, you then need to group together the assets for which you want to see the total risk. You do this by assigning them all to the same benchmark asset in the Benchmark Asset Settings window. So to continue the example in See "The Greeks Display Window ", you could create two groups for this strategy, one for the fuel assets and one for the base metals, as seen in See "The Benchmark Assets Settings window ". For detailed instructions on how to do this, click here.
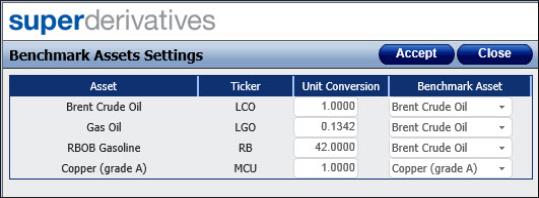
Figure 4: The Benchmark Assets Settings window
Subsequently, in the Greeks Display window, when you:
Choose to display a single benchmark asset, you see a separate column for each asset that is linked to that benchmark asset (as seen in See "Displaying a Single Benchmark Asset ").
In this display all the assets displayed are linked to a single asset, and the risk of each asset in its native unit is also converted into the benchmark asset's unit–this is done using the defined conversion factor between that asset and the benchmark asset as defined in the Settings window.
So when you choose to display the results in the benchmark asset's relative unit (by clicking the Relative Unit button as seen at 3 in See "Displaying a Single Benchmark Asset ") you see a total risk across all the assets.
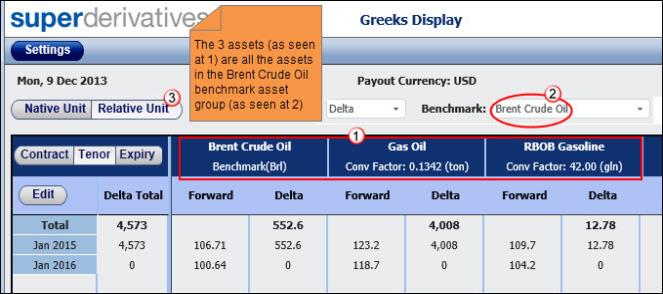
Figure 5: Displaying a Single Benchmark Asset
Choose to display all benchmark assets, you see a separate column for each defined benchmark asset group (as seen in See "Displaying all Benchmark Assets ").
Each column contains the results for all the assets in that group. So in the image below, the results for the Brent Crude Oil benchmark asset include the results for following assets-Brent Crude Oil, Gas Oil and RBOB Gasoline.
In this display mode you will see the total risk across the strategy if you choose to display the delta cash, gamma cash or vega results. However, you will not see a total result for the Greeks that are displayed in units, i.e., for the delta (as seen in See "Displaying all Benchmark Assets ") and gamma, unless each of the groups displayed is, by chance, based on the same unit.
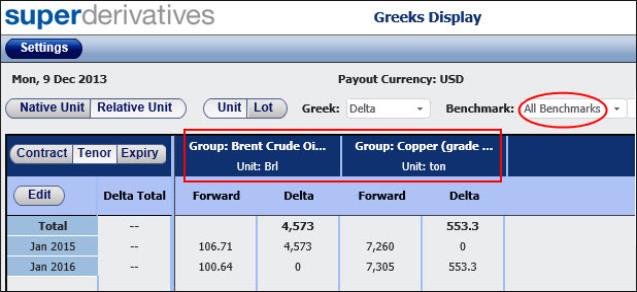
Figure 6: Displaying all Benchmark Assets
In the Greeks Display window you can then:
Control the groups of assets via the Benchmark Asset Settings window.
Control the display mode, i.e., if the buckets are displayed across contracts or tenors (using the Contract or Tenor buttons) or if the results are displayed in the corporate mode (using the Expiry button).
Controlling What is Displayed in the Greeks Display Window
In the Greeks Display window once you have selected the display mode–with the results bucketed across contracts or tenors, or displayed per expiry date–you can then control the display of the results as follows:
Display the results for all assets in a single benchmark asset group or for all benchmark groups.
You do this using the Benchmark dropdown list. For more information on the two different options available, click here.
Display the results for each asset in the unit native to that asset, and not in the unit of the benchmark asset.
You do this using the Native Unit button.
This affects the display of the forward, as well as of the delta and gamma results–which are the only results displayed in units.
Of course, in this mode you do not see a total result for either the delta or the gamma, as the results for each asset displayed will necessarily be in different units.
Display the results for each asset in the unit that is native to the benchmark asset, and not in the unit of the individual asset itself.
You do this using the Relative Unit button.
This affects the display of the forward, as well as of the delta and gamma results–the only results that are displayed in units. For these results, the results are converted from the asset's unit to the unit of the benchmark asset, using the conversion factor between these two assets as defined in the Benchmark Asset Settings window.
Toggle between displaying the results in units or in lots.
You do this using the Unit <> Lot buttons.
These buttons only affect the display of the delta and gamma results–the only results that are displayed in units.
Toggle between seeing the results for the various Greeks.
You do this using the Greek dropdown list.
You can choose between any of the following:
Delta
This displays the change in an instrument's present value for a small change in the underlying and is displayed in units of the asset.
Delta cash
For most assets this is calculated as follows:
Delta forward in units * price of the underlying contract
Where:
The underlying contract can be any of the following–the asset's nearby contract, 3MT contract, front month contract, specific contract, day ahead price, or rolling 3rd future contract. Which of these underlying contracts is actually used in the delta calculation for each instrument in the strategy depends on the underlying defined for that instrument–in the Underlying dropdown list in the pricing page.
|
|
Which of the various underlying options are available for each instrument in the pricing page depends on the type of instrument defined and the asset selected. |
The delta forward in units is the value displayed in the pricing window as the Delta Future result.
This calculation is used for all assets except for OTC base metals where the instrument's underlying is set to spot and for OTC precious metals. For these assets the delta is calculated as delta spot in units * spot.
Gamma
This displays the percentage change in delta for a 1% move in the underlying and is displayed in units of the asset.
Gamma cash
This is calculated as follows:
Gamma in units * price of the underlying contract
Where the underlying contract can be any of the following-the asset's nearby contract, 3MT contract, front month contract, specific contract, day ahead price, or rolling 3rd future contract. Which of these underlying contracts is actually used in the delta calculation for each instrument in the strategy depends on the underlying defined for that instrument–in the Underlying dropdown list in the pricing page.
Vega
This displays the percentage change in value for a 1% change in volatility based on the ATM vol.
Managing the Groups in the Greeks Display Window
You manage the groups for the current strategy in the Greeks Display window in the Benchmark Asset Settings window. This window is accessed by clicking the Settings button in the Greeks Display window.
In the Benchmark Asset Settings window you can then:
Control the grouping of assets in this strategy.
You do this by assigning each asset in the current strategy to a particular benchmark group.
By default SD assigns each asset to a group of its own, i.e., for each asset you see that its benchmark asset is set to itself (as seen in See "The Benchmark Asset Settings Window ").
| Figure 7: | The Benchmark Asset Settings Window |
You can then assign each asset as relevant to a different benchmark asset, which in effect assigns it to a group of all assets assigned to that benchmark asset.
You do this using the Benchmark Asset dropdown list for each asset individually.
Manage the conversion factor between an asset and its selected benchmark asset.
The conversion factor is used by SD to convert the results in the asset's native unit into the benchmark asset's unit.
By default in the Benchmark Asset Settings window for each listed asset in the Unit Conversion column you see SD's conversion factor between this asset and the selected benchmark asset. You can then edit this value if required, by manually entering a value in this column.
After making any changes in this window, you must then click Accept. When you click the Accept button, if any of the edited assets are currently displayed in the main window, the display is automatically updated in keeping with your changes in the Benchmark Asset Settings window. So if you edited an asset's conversion factor with its benchmark asset and it is displayed in the Greeks Display window, when you click the Accept button, the displayed values for that asset in the main window are automatically updated using the new conversion factor.
In the Greeks Display window you can choose between the following display modes—contract display mode, the tenor display mode and the expiry dates display mode.
You switch between the various display modes using the Contract, Tenor and Expiry buttons.
In addition, you can also edit the defined contracts and tenors.
In the:
Contract display mode
In this mode, which is selected by clicking the Contract button, SD displays the bucketed risk for supported instruments across the contracts out to the latest expiry date in the strategy.
This display mode is of course useful for hedging your risk.
For example, if you are using Asian instruments (generally based on a rolling front month contract), then your total delta risk (as seen in the pricing page at 1 in See "The Contract Display Mode Lets You See the Risk Across the Contracts") will necessarily be distributed over a number of futures contracts. Therefore, in order to accurately hedge your delta risk (i.e., to be totally delta neutral) you will need to see the risk broken down across the relevant contracts.
Using the Contract display mode (as seen at 2 in See "The Contract Display Mode Lets You See the Risk Across the Contracts") lets you do this–you will see the total risk broken down across the relevant contracts (as seen at 3 in See "The Contract Display Mode Lets You See the Risk Across the Contracts").
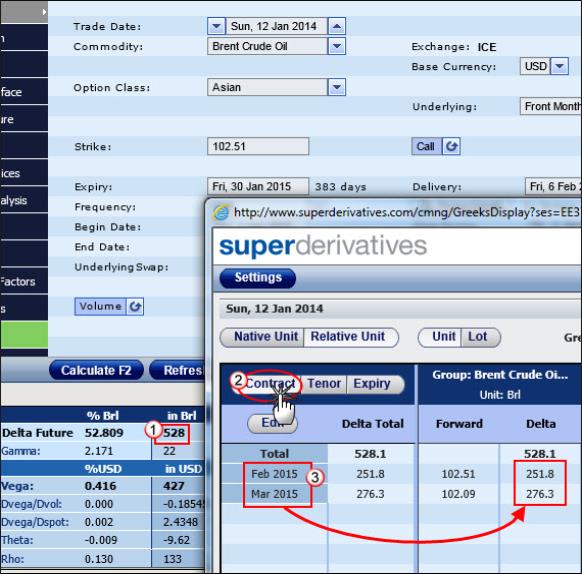
Figure 8: The Contract Display Mode Lets You See the Risk Across the Contracts
Tenor display mode
In this mode, which is selected by clicking the Tenor button, SD displays the bucketed risk for supported instruments across the defined tenors.
If you have a portfolio with different underlying assets, then this display mode provides you with a useful way of seeing when exactly the risk is due, i.e., in which tenor.
For example, your portfolio contains two vanillas, one based on the LCO March 2014 contract and one on the Fuel Oil 1% FOB MED March 2014 contract. If you look at the portfolio's risk in the contract display mode, as both assets are based on the March 2014 contract, you will necessarily see the risk of both assets assigned to the March 2014 contract. However, because the two instruments are based on different assets, each with a different market convention, they expire on different dates, and therefore the risk is due on different dates.
Accordingly, if you look at the risk in the tenor display mode, you will see in which tenor the risk is due (as seen in See "The Tenor Display Mode Lets You See the Risks Across the Defined Tenors" at 1 for the LCO asset and 2 for the Fuel Oil asset). This gives you a fuller picture of where the risk lies.
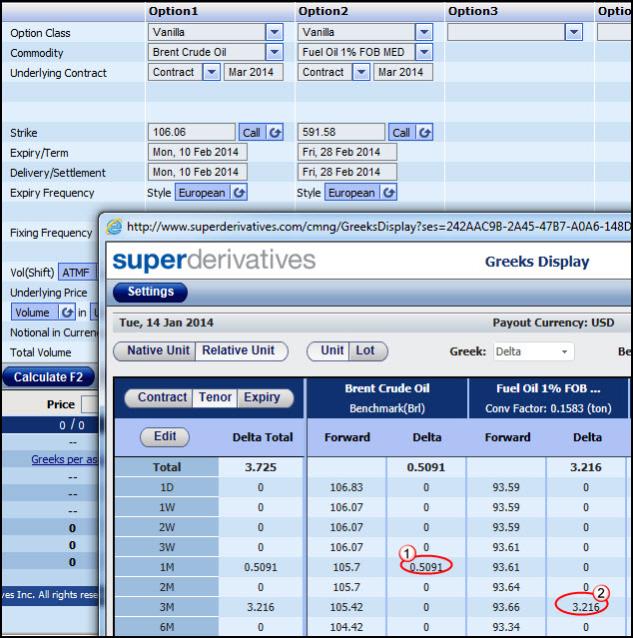
Figure 9: The Tenor Display Mode Lets You See the Risks Across the Defined Tenors
Expiry display mode
In this mode, which is selected by clicking the Expiry button, SD displays the strategy's risk across the underlying expiry dates.
Being able to see the risk on the relevant expiry dates is necessary, for example, for regulatory and reporting purposes. This is because, from a corporate accounting perspective, the exposure must be observed on the expiry dates.
In this realm, the information needed is when the risk is due, rather than across which futures contracts or tenors it falls.
In addition, the expiry display mode is also similar to the way risk is viewed in FX portfolios, and therefore provides a more familiar view to users more used to the FX convention.
Another advantage of the expiry display mode is that as it does not involve bucketing it automatically supports all instruments, even those for which bucketing is not currently available. That is, you can load a strategy with any of the following underlying instruments into the Greeks Display window:
TARN instruments
Basket and quanto basket
Best of
Worst of
Compound Asian strip and compound Asian strip collar (only the delta, delta cash and vega results are displayed)
|
|
As these instruments are not yet supported in the contract or tenor display modes, if a strategy contains one or more of these instruments, it is automatically loaded into the expiry display mode–and the other two display modes are disabled. |
Editing the Contracts and Tenors
You can edit the contracts and/or tenors that are displayed in the Greeks Display window. That is, you can add additional contracts or tenors and/or delete any that you do not want to be included.
When you:
Add a contract/tenor, it is automatically added to the list in the right position.
Delete a contract/tenor which currently contains risk, if there is a valid contract/tenor to move the risk amount to, this is done automatically. However, if there is no other contract/tenor to move it to, then when you delete it, you are warned that the risk contained in this contract/tenor will no longer be displayed. It will of course be displayed again if you later add a contract/tenor that can contain it.
Note that in order to edit the contracts, you must have the contracts displayed (by clicking the Contract button); to edit the tenors, you must have the tenors displayed (by clicking the Tenor button).
To edit the contracts/tenors:
| 1. | In the Greeks Display window click either the Contract or the Tenor button. |
| 2. | Click the Edit button. |
| 3. | In the window that opens: |
To add a contract/tenor, click the Add button and then in the field that is added to the end of the list enter the relevant contract or tenor.
To delete a contract/tenor, click the Delete button and then click OK.
| 4. | Click Accept. |