When defining a strategy (whether a single instrument or a portfolio), it is useful to know what would happen to its calculated results if certain parameters were to change. For example, you may want to know how changing the strike and/or expiry date of a vanilla would affect its market price.
The Pricing Table window lets you easily calculate multiple scenarios of a single strategy. By letting you see, for example, how editing the values of up to two different variables (or input data parameters) will affect the strategy's results (when all other strategy configuration data remains the same), the tool lets you easily perform What-if analyses, letting you plan your strategies in a risk-free environment.
In the:
Single Option page the Pricing Table is supported for any of the instruments supported in the Pricing Table.
Portfolio page, in order to load a portfolio to the Pricing Table it must contain at least one of the instruments supported in the Pricing Table.
Supported instruments in the Pricing Table The supported instruments are as follows-vanilla, vanilla strip, swap, swap strip, Asian, Asian strip, Asian digital, Asian digital strip, European knock out and European knock out strip.
An overview of working with the Pricing Table tool:
| 1. | You first define the strategy—the instrument or the portfolio—in the relevant pricing page, and then load it to the Pricing Table. |
| 2. | In the Pricing Table you define the scenario variables, i.e., you tell the system which input data parameters to change for each scenario. |
| 3. | To apply these settings you click the Generate Table button. |
| 4. | You define which result you want to calculate and choose how you want to display the results. |
| 5. | Finally you instruct the system to calculate the results for the underlying scenarios for the uploaded strategy by clicking the Calculate button. |
For a detailed list of the buttons and fields in the Pricing Table see Table 1.
|
Field/Button |
Description |
|
Interrupt |
Lets you stop the calculation process on the current strategy before it is completed. |
|
Calculate |
Instructs the system to calculate the current strategy's scenarios. You can see the progress of the calculation process in the status bar at the bottom of the window. |
|
Option Description |
Defines the current strategy loaded into the Pricing Table. If it is a single instrument, it defines the instrument, including the type, strike, asset, expiry date, etc. Currently this field is not activated for a portfolio. |
|
Horizontal |
Defines the input data parameter for the horizontal axis. |
|
Vertical |
Defines the input data parameter for the vertical axis. |
|
Step |
Defines the size of the steps on the horizontal/vertical axis. |
|
Centered |
Defines the point around which the steps are to be measured. |
|
Results |
Defines which result is to be calculated at each scenario. |
|
Generate Table |
Instructs the system to calculate the settings for the horizontal axis and the vertical axis. |
|
Mid <> Bid <> Ask |
Lets you toggle between displaying the calculated results as a mid, bid or ask value. |
LOADING A STRATEGY TO THE PRICING TABLE
You can load any of the following strategies to the Pricing Table:
A single instrument from the Single Option page.
A portfolio from the Portfolio page.
|
|
For each instrument in the strategy you must define all details in the pricing page before clicking the Pricing Table button, although the notional definition is optional, as it is in the pricing page itself. However, if you do not define a notional for an instrument in the pricing page, in the Pricing Table page the results for that instrument will only be available as a percentage. That is, you will not be able to toggle its results to an amount. |
To load a single instrument to the Pricing Table:
| 1. | In the Single Option page define the instrument. |
| 2. | From the ribbon bar in the Trader tab or Sales tab or Structurer tab click the Pricing Table button. The instrument is loaded to the Pricing Table. |
To load a portfolio to the Pricing Table:
| 1. | In the Portfolio page open an existing portfolio or define a new one. |
| 2. | From the ribbon bar in the Trader tab or Sales tab or Structurer tab click the Pricing Table button. The portfolio is loaded to the Pricing Table. |
DEFINING THE VARIABLES IN THE PRICING TABLE
Once you have uploaded a strategy to the Pricing Table by default the horizontal axis is set to Relative Strike and the vertical axis is set to Expiry. However, you can then edit the default settings for both the horizontal axis and/or the vertical axis. All other data (except that defined in the Horizontal and Vertical dropdown lists) is taken from the strategy definition in the pricing page.
For each axis the system needs to know the following:
Which input data parameters to change for the calculation of each underlying scenario. For example, the strike or the expiry date. For a full list of the supported input data parameters see “What Input Data Parameters Are Supported?”.
By how much to change the input data parameter between each step and from/around which point.
To define the variable settings for an axis:
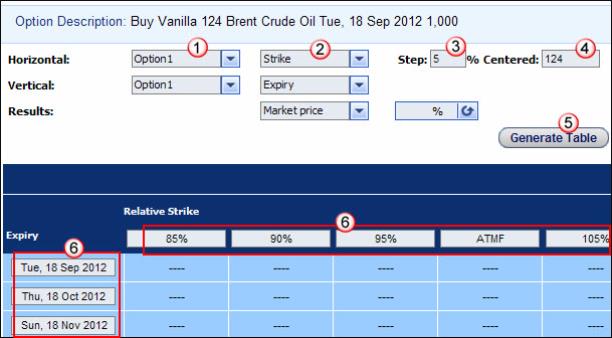
| 1. | For an axis define the input data parameter for a given option. You do this by first selecting the relevant option in the dropdown list as seen at 1 in See "Defining an Axis in the Pricing Table " and then the relevant input data parameter. |
For a full list of the supported input data parameters see “What Input Data Parameters Are Supported?”.
| 2. | For most of the parameters you must also set by how much the input data parameter selected in Step 2 will change between steps (you do this by defining the amount in the Step field as seen at 3 in See "Defining an Axis in the Pricing Table ") and, if relevant, from/around which point the steps will be measured (you do this in the Centered field as seen at 4 in See "Defining an Axis in the Pricing Table "). |
| 3. | Repeat Step 1 to Step 2 for the other axis. |
| 4. | After making all necessary changes click the Generate Table button. The system uses the defined variables to populate the table's axes. |
| 5. | For either the horizontal and/or the vertical axis you can then edit any step directly in its row or column heading as seen at 6 in See "Defining an Axis in the Pricing Table ". |
|
|
If you make manual changes to either of the axes in this way, if you then click the Generate Table button, these manual changes will be overwritten. |
Figure 1: Defining an Axis in the Pricing Table
WHAT INPUT DATA PARAMETERS ARE SUPPORTED?
For the horizontal axis and the vertical axis you can choose from the following input data (for a defined instrument in the strategy):
Strike
This covers the Strike and the Relative Strike scenario variables. Whichever one you choose, the system displays the default strike values in the matrix. For the Strike scenario variables, the default values are centered around the original strike value; each strike step is shifted by 5%. For the Relative Strike scenario variables, the default values are centered around the ATMF strike; each strike step is shifted by 5%. You can then overwrite each value with your own strikes, whether as relative or absolute values.
Expiry
When you select the Expiry scenario variable, the matrix is populated with the default expiry dates. You can of course then overwrite any of these defaults with your own expiry dates.
CALCULATING THE UNDERLYING SCENARIOS
In the Pricing Table, once you have defined the scenario variables (using the Horizontal and Vertical fields) and which result you want to see displayed, you can then calculate the results for each scenario simultaneously.
You do this by clicking the Calculate button.
What is a scenario? A scenario is the defined strategy together with a given set of the defined variables. So for example, if you define that your two variables are the strike and the expiry date, at each scenario you will see a result for the strategy with a different strike and expiry, as seen in See "Calculating the Underlying Scenarios in the Pricing Table ".
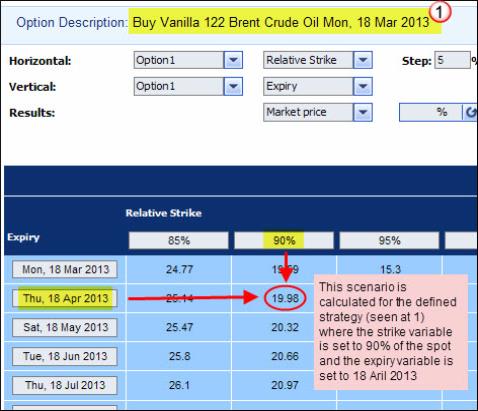
Figure 2: Calculating the Underlying Scenarios in the Pricing Table
The results are:
Calculated using the current market rates.
This is true unless you have manually edited the rates in the current session using the Term Structure page and then saved these changes. This includes changes to any of the supported fields in the Term Structure page (e.g., to the future prices or the ATMF volatility spread), as well as to the volatility data (via the Volatility Data page) and the yield curve data (via the Yield Curve window). If that is the case, your edited rates are used instead until you tell the system otherwise.
It is important to note that if you manually edited the market data displayed for the strategy in the pricing page, these changes are not used in the Pricing Table.
Calculated for the variable settings displayed in the actual table, i.e., as seen in the row headings of the vertical axis and the column headings of the horizontal axis. So if you have edited the variable settings using the fields at the top of the page, make sure you apply those changes to the table itself by clicking the Generate Table button.
During the calculation process, you can see its progress in the status bar at the bottom of the window.
Although only one set of results is displayed at a time, the scenario calculation actually calculates all relevant results simultaneously for the current strategy. This means that once the scenario calculation is complete, you can then easily toggle to a different set of results using the Results dropdown list.
For a detailed explanation of the displayed results and how to change the display of these results, see “Understanding the Displayed Results”.
UNDERSTANDING THE DISPLAYED RESULTS
When you calculate the defined scenarios for a strategy, although only one set of results is displayed at a time, the system actually calculates all the results simultaneously.
Which results are available depends on the current instrument in the pricing page. You can choose from the following (using the dropdown list seen at 1 in See "Understanding the Displayed Results in the Pricing Table "):
Market price
Delta
Gamma
Vega
By default, for each result the system displays the ask value as a percentage. However, you can choose to display the results:
As a percentage or as an amount. You do this using the % <> Amount button (as seen at 2 in See "Understanding the Displayed Results in the Pricing Table ").
|
|
If you did not define a notional for the instrument in the pricing page, in the Pricing Table page the results are only calculated as a percentage (so you cannot see these results as an amount). Also, if you have multiple assets in the Portfolio page, the results are only calculated as an amount (so you cannot see these results as a percentage). |
As a mid, bid or ask value.
You do this using the Mid <> Bid <> Ask buttons as seen at 3 in See "Understanding the Displayed Results in the Pricing Table ".
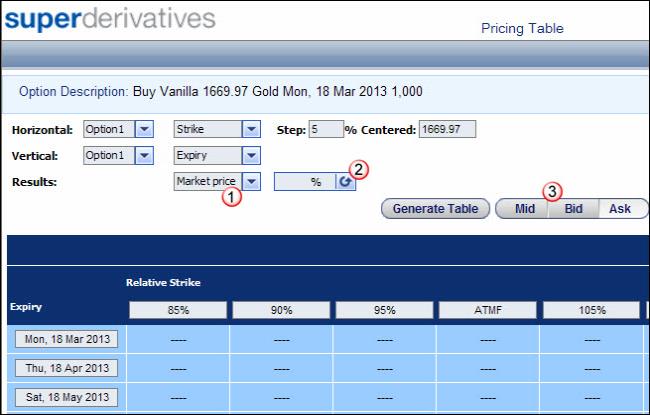
Figure 3: Understanding the Displayed Results in the Pricing Table