The Volatility Data page displays the data used to create the volatility surface for the current asset. For each displayed tenor you see the data that is used to calculate the smile for that tenor.
You access this page by clicking the Volatility button in the Term Structure page.
The following topics are covered:
Understanding the volatility modes
Understanding the fields & buttons in the Volatility Data window
Changing the market data source in the Volatility Data window
What can be done in the window
This includes editing the market data.
Understanding the Volatility Modes
In the Volatility Data window the volatility data for each asset can be displayed in one of two volatility modes—sticky delta or sticky strike.
In the:
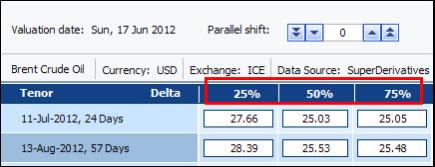
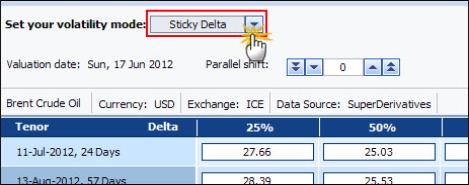
Sticky delta volatility mode, at each tenor the volatility data is defined for the 25%, the 50% and the 75% delta strikes.
| Figure 1: | Sticky Delta Volatility Mode |
Sticky strike volatility mode, at each tenor the volatility data is defined for a variety of strikes—and each strike is defined as a given % of the displayed forward rate for that tenor. So, in See "Sticky Strike Volatility Mode", 71.62 is the volatility of the contract that expires in July when the strike is 25% of the forward rate, i.e., 25% of 112.46, etc.
|
|
The tenor's forward rate is simply the forward rate in the system at the time the volatility data was saved for that date in this volatility mode. |
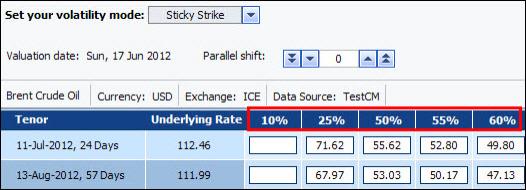
| Figure 2: | Sticky Strike Volatility Mode |
If you are using:
SD's market data for this asset, the volatility data is always displayed in the default volatility mode set for your user for this data source for this asset. This can be either the sticky delta or the sticky strike mode. However, you cannot subsequently change the volatility mode in the Volatility Data window itself.
A different market data source, the volatility data is displayed in the default volatility mode set for your user for this data source for this asset, i.e., to sticky delta or sticky strike. However, you can then subsequently change the default volatility mode for this asset for your user via the Volatility Data window itself.
|
|
For each user in your company you can instruct SD what the default volatility mode should be per asset per market data source. |
Fields and Buttons in the Volatility Data Window
The following fields and buttons appear in the Volatility Data window.
|
Field or Button |
Description |
||||||
|
Export |
Exports the data in the Cash Flow Dates window to an Excel spreadsheet. |
||||||
|
Paste |
Lets you paste the following data from Excel into the Volatility Data window: Tenors, i.e., the dates of the tenors Volatility data |
||||||
|
Displays the rates saved in the system for the current asset for the displayed valuation date for the relevant volatility mode. For the SD market data source the relevant volatility mode is the default volatility mode set by the system for the user for this asset. For any other market data source, it is the volatility mode selected in this window. |
|||||||
|
Charts |
Lets you display the volatility data in a chart format. |
||||||
|
Set your volatility mode |
Lets you decide whether to display the data in the Sticky Delta or the Sticky Strike mode. |
||||||
|
Save to DB |
Instructs the system to save the displayed data for the displayed valuation date for the selected market data source.
|
||||||
|
Real Time checkbox |
Instructs the system to save the displayed data as the real time rates as well as the rates for the displayed valuation date.
|
||||||
|
Valuation date |
Defines the date for which the data is displayed. |
||||||
|
Parallel shift |
Lets you shift all the data up or down by a certain amount. You do this using the Parallel Shift functionality. |
||||||
|
Accept |
Once you have edited the data in this page, to instruct the system to save this data (so it can use it to recalculate the smile for each tenor and to then use these new smiles to calculate the volatility surface for the rest of the session), you must then click the Accept button. This action also closes the Volatility Data window.
|
Changing the Market Data Source in the Volatility Data Window
You can see the volatility data for different market data sources. To do this, you must change the market data source in the Settings window. Once you have done this, in the Volatility Data window you will see the data for the selected source.
It is important to note that if you select a market data source for which you have not yet uploaded your own data, by default SD opens it with SD's rates. This is noted in the window, in the Data Source field.
Tip In this instance, although the data source says “SuperDerivatives“, you can tell that the window is actually displayed for a market data source other than SuperDerivatives due to both of the following visual clues. Firstly, the Save to DB and Save to Real Time checkbox are displayed (these two elements are not displayed when you are in the window for the SD market data itself). In addition, if you point at the Save to DB button, a popup tells you for which source the data will actually be saved (as seen in See "Saving Data to a Different Source ").
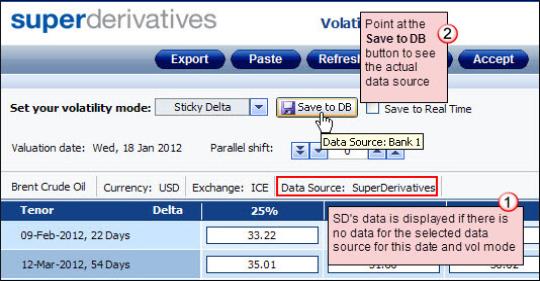
Figure 3: Saving Data to a Different Source
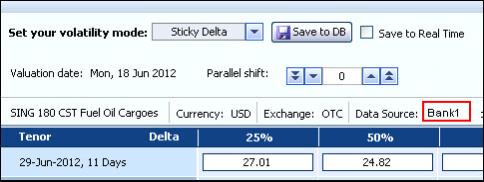
Once you have uploaded your own rates for this data source and saved it the database, SD changes the label to that of the underlying source, as seen in See "Data Source Label ".
Similarly, if you have selected a market data source other than SD and there is no data for the selected valuation date and volatility mode:
| 1. | The system first looks backwards to see if there is uploaded data for a previous date. If there is—it displays it. If there is not, go to Step 2. |
| 2. | The system then checks if there is SD market data for this valuation date and volatility mode—if there is, it displays it. If there is not, go to Step 3. |
| 3. | The system then checks the default volatility mode for this user for this asset and checks if there is SD market data for this mode. If there is, it displays it; if there is not, go to Step 4. |
| 4. | The system then checks the general user default volatility mode for this asset and checks if there is SD market data for this mode. If there is, it displays it; if there is not, the window will not contain any data. |
To change the market data source:
| 1. | On the ribbon bar in the Home tab click the Settings button. |
| 2. | In the Default Settings tab in the Data Source dropdown list select the relevant data source. |
| 3. | Click Save and then OK. |
What can you do in the Volatility Data Window?
In the Volatility Data window for the current asset you can:
Change the default volatility mode for your user.
You do this using the Set your volatility mode dropdown list, as seen in See "Changing the Volatility Mode for your User ".
This functionality is only supported if you are using a market data source other than SD. If you are using SD's market data, your volatility mode is predefined for your user for this asset.
| Figure 5: | Changing the Volatility Mode for your User |
|
|
If you change the volatility mode for your user, this change is immediately saved. |
Display the volatility data for different market data sources.
You do this via the Settings menu. For more information click here.
Edit the volatility data for use by your user in the current session.
You can edit the volatility data used for this asset for the displayed valuation date for your user only in the current session.
If you are using SD market data, this feature is supported for the default volatility mode only; if you are using a different market data source, you can edit the data for one or both of the volatility modes (although not for both modes simultaneously).
Click here for more information on how you can actually edit the volatility data.
Upload volatility data for a market data source.
If you have your own market data source, you can upload your own volatility data for this source via the Volatility Data window.
This data is then automatically available to all users in your user group who are using the relevant market data source.
You can edit the volatility data for one or both of the supported volatility modes (although not for both modes simultaneously).
In addition, when you save the edited volatility data, you can also decide if you want to only save the edited data for the selected valuation date or also for the current, real time rates. If you only save them for the selected valuation date, they are saved as that date's end of day rates. If you save them also for the current, real time rates, they will be used for the current date for this asset in this volatility mode until you next upload volatility data for this asset in this volatility mode.
Click here for more information on how you can actually edit the volatility data.
|
|
|
Refresh the volatility data displayed.
You can refresh the displayed volatility data. You do this using the Refresh button.
Display the volatility data in a chart format.
You do this by clicking the Charts button and then the relevant option.
Editing Market Data in the Volatility Data Window
You can change the shape of the volatility surface by editing the data to be used in a number of ways. This is true regardless of the market data source for which you are editing the data and whether you are editing the data for use by your own user or uploading data for all users in your group.
You can edit the data in any or a combination of the following ways:
Manually.
You do this by simply entering the required values in the relevant cells.
Using the Parallel Shift functionality.
For more information on using the Parallel Shift functionality, click here.
Pasting the data from an Excel spreadsheet.
For more information on copying the data to an Excel spreadsheet and then pasting it back into the Volatility Data window, click here.
|
|
The rates per asset for each volatility mode are saved separately. That is, there is no overlap between the two data sets, even in the same asset. |
Saving the changes for your own use in the current session Regardless of how you have edited the data in the Volatility Data page, to instruct the system to save the edited data (so it can use it to recalculate the smile for each tenor and to then use these new smiles to calculate the volatility surface for the rest of the session) for your user for this session, you must click the Accept button. Although as soon as you click the Accept button the data is automatically saved into the system and the volatility surface is automatically recalculated, to see the relevant changes in the open Term Structure window you must click the Recalculate button in the open Term Structure window. The system alerts you to this fact using the status bar in this window.
Saving the changes for all users in your group Regardless of how you have edited the data in the Volatility Data page, to instruct the system to save the new rates for all users in your group, you must first click the Save to DB button.
By default, clicking the Save to DB button saves the data displayed in the page for the displayed valuation date. If you also check the Save to Real Time checkbox, the data is also saved to the real time database. This means this data will be used until you change it in the future, either by uploading new data or by resetting your market data source to SD. After saving the edited data for all users in your group, to recalculate the smile for each tenor and to then use these new smiles to calculate the volatility surface for the rest of the session, you must also click the Accept button and then the Recalculate button in the open Term Structure page.
Using the Parallel Shift Functionality
This functionality lets you shock all the data displayed (i.e., the volatility displayed for each delta/strike in each tenor). This means that you shift all the data up or down by the same amount.
By default, the single arrow moves the volatilities up/down by 0.10; the double arrow moves the volatilities up/down by 0.25. Alternatively, you can also manually define an amount in the textbox, and then click <Return> on the keyboard or simply click anywhere outside the textbox to move all the volatilities up/down by this defined amount.
Once you have done this and until you manually instruct the system to remove any changes by clicking the Refresh button, any shift in rates is retained during the current session. That means that if you shift the rates and then later in the same session shift the rates again, this latter shift is added to any previous shift(s) already made in the session.
Copying and Pasting Data in the Volatility Data Window
In the Volatility Data window you can copy and paste the data—both the tenors and the volatility data at each delta or strike (as relevant to the current volatility mode).
This means that you can copy the data in the Volatility Data window and then paste it into Excel (using the Export button) or copy the data in Excel and paste it into the Volatility Data window (using the Paste button).
You can paste tenors and data.
Note the following:
Pasting data into the Volatility Data window always overwrites the existing tenors.
During the paste action itself there is no validation of the inserted dates. However, each date itself must be in a supported Excel date format.
The pasted data must be in the supported format, i.e., for each tenor you must define a date, and a value for each delta or strike (depending on the current volatility mode).
To see the format expected by SD, see the Excel spreadsheet created by SD when you first export the data from the Volatility Data window.