SDX Commodities & Energy uses a ribbon interface, which is designed to help you find the tools and functionality you need based on the context you are currently in.
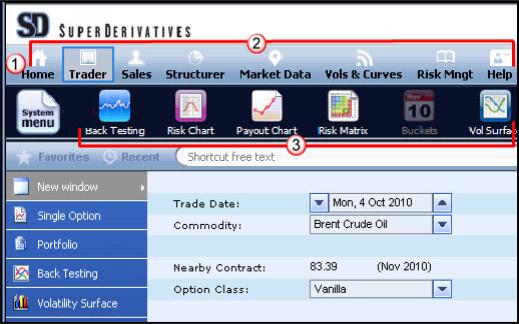
The ribbon interface consists of a top ribbon bar (as seen at 1 in See "Ribbon Interface ") that contains a set of tabs (2 in See "Ribbon Interface ").
Each tab is organized around a specific scenario or task, such as the role of a trader or salesperson or risk management, and only lists the functions relevant to the current scenario or task at hand in the form of buttons. The buttons in a tab (as seen at 3 in See "Ribbon Interface ") each carry out an individual command or display a menu of commands.
This gathering of functionality into logical groups (or tabs) has been adopted to help you be more productive. It does this by:
Only displaying functions relevant to the current task. This makes it easier to find the right one, and you do not waste time looking for relevant functions.
Suggesting useful functionality for your current task that you might not have been aware of.
By default the ribbon bar opens in the vertical orientation. In the vertical orientation the ribbon bar temporarily replaces the left hand tabs. However, note that all functionality in the left hand tabs can be easily accessed by clicking the Open button which is displayed in each tab.
Besides being able to change the displayed tab in the ribbon bar (by simply clicking on the tab you want to display) you can also:
Use the System Menu
Change the ribbon bar's orientation between a horizontal and vertical view
Access a list of your instruments recently priced via the Shortcut field in the Single Option page
In the Portfolio page access a list of your recently displayed portfolios
Access your Favorites list in the Single Option page
Access your Favorites list in the Portfolio page
Access other SD pricers
The available tabs are as follows:
Home
This tab contains access to the following functionality:
Access to the Customize window (via the Settings button)
The Excel add-in
Access to the Colors menu
Open function
Save function
Add to Portfolio function (only in the Single Option page)
Trader
This tab gives you access to the functionality relevant for a trader including:
Back Testing (only if you are in the Single Option page)
Historical Analysis
Strip Generator (only if you are in the Portfolio page)
Risk Chart (only if you are in the Portfolio page)
Payout Chart (only if you are in the Portfolio page)
Risk Matrix
Greeks Display
Buckets (in the Single Option page it is only enabled if relevant for the current instrument)
Pricing Table
Volatility Surface
Term Structure
Yield Curve
CVA results in the Credit Check window (only if you are in the Single Option page)
For more information see Working with CVA.
|
|
This is the default tab that opens when you access the pricer, unless you change the default setting for your user. |
Sales
This tab gives you access to the functionality relevant for a salesperson including:
Back Testing (only if you are in the Single Option page)
Historical Analysis
Term Sheet Generator
Who to Call
Clients' Activity tool
Payout Chart
Strip Generator (only if you are in the Portfolio page)
CRM (this opens the Blotter in TradeView)
CVA results in the Credit Check window (only if you are in the Single Option page)
For more information see Working with CVA.
Structurer
This tab gives you access to the functionality relevant for a structurer including:
Back Testing (only if you are in the Single Option page)
Strip Generator (only if you are in the Portfolio page)
Pricing Table
Risk Chart
Payout Chart
Term Sheet Generator
Risk Matrix
Greeks Display
Term Structure
CVA results in the Credit Check window (only if you are in the Single Option page)
For more information see Working with CVA.
Market Data
This tab contains buttons to all the market data pages—Term Structure, Yield Curve, Volatility Surface, Correlations, Conversion, Historical Analysis and Exchange Data, as well as the Custom Assets Management Window .
Risk Mgmt
This tab gives you access to the risk management functionality. You can access different views–the Blotter, the Book Tree page (by clicking the Select Books button) and the Dashboard.
Help
This tab lets you access the online user guide and DGX Chat (via the Community Chat button), as well as the buttons to contact Customer Support via Chat or email. It also contains access to the tutorials and the About button.
By default the system will open in the Trader tab. However, for your user you can set which of the two user type tabs–the Trader tab or the Sales tab–opens by default when you access SDX Commodities & Energy. You do this in the Customize window > Default Settings tab using the Show system in format for dropdown list. The Sales Person option will open the ribbon bar in the Sales tab; the Trader, Corporation and Hedge Fund options will open the ribbon bar in the Trader tab.