In both the Single Option page and the Portfolio page, for a vanilla swaption or any of the supported swaption strategies, in addition to the ATMF volatility and the normal ATMF volatility the system also displays a slice of the volatility skew data used in the volatility surface.
The volatility skew data:
Is displayed for a given width that is measured in basis points (bp) from the ATM volatility, where each available width represents a different strike in the underlying volatility surface.
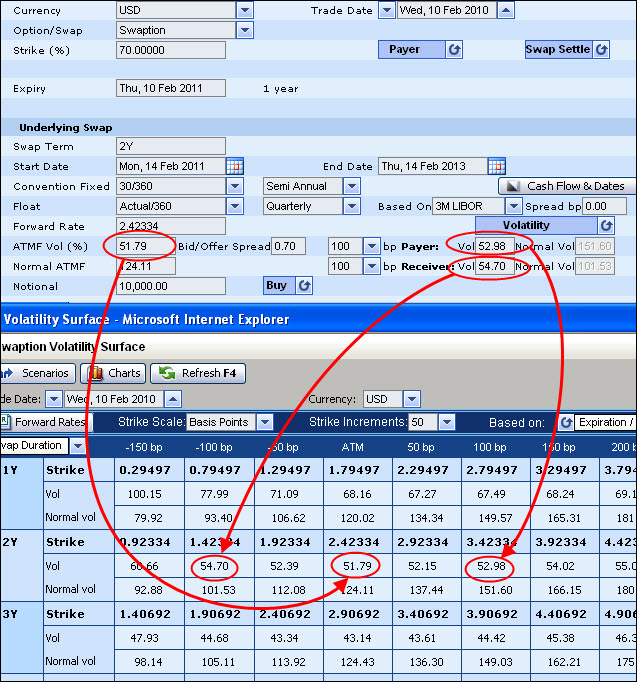
As seen in Figure 1 consists of the volatility (or log normal volatility) and the normal volatility for both the payer and the receiver, where the payer represents a strike above the ATM volatility and the receiver represents a strike below the ATM volatility.
By default this data is taken from the system's volatility surface for the current currency and for the expiry and swap tenor defined for the current instrument.
It is important to note that you only see the skew data after you have defined the instrument’s expiry and the tenor of the underlying swap. Also, in the Portfolio page for a supported instrument this data is only displayed in the Single Option Data window (which is accessed by clicking the instrument’s Data button).
Figure 1: Viewing the Volatility Skew Data for a Specific Expiry & Tenor
By default the system displays the volatility skew data:
For both the payer and the receiver at a 100 bp width from the ATM value.
However, if the 100 bp width for the receiver results in a negative strike, the system attempts to display the 75 bp width, etc. until a positive strike can be displayed for the receiver side.
You can then choose to see the volatility skew data for a different width from the ATM volatility. You can define the width for both the payer and receiver individually by selecting it from the relevant dropdown list (as seen in Figure 2) or by entering one of the predefined values in the dropdown list into the field. As soon as you change the width, the system automatically displays the volatility for the newly selected width.
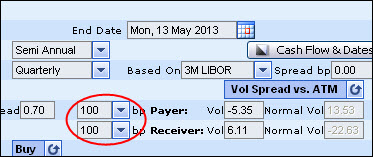
| Figure 2: | The Volatility Skew Is Displayed for a Defined Width |
As a spread from the ATM volatility.
However, you can then change the display of the skew data in order to see it as an absolute value (i.e., the ATM volatility + the spread). You do this using the Vol Spread vs. ATM <> Volatility toggle button as seen in Figure 3.
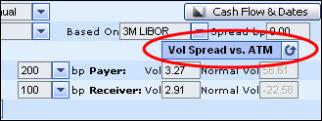
| Figure 3: | Displaying the Volatility as a Spread or Absolute Value |
Editing the Volatility Curve for the Current Instrument
When pricing a supported instrument, you can use the Payer and Receiver fields to modify the volatility curve that will be used to price this instrument for the defined expiry and tenor only.
You do this by editing the volatility (i.e., the log normal volatility) rate for a certain width for the payer and/or receiver.
It is important to note that:
When defining the skew for the receiver, you must enter a value that is greater than zero.
You can only modify the payer / receiver volatility for a single width each at one time, i.e., you can only provide two edited skew points at one time, one for the payer and one for the receiver.
This is because the system does not save your modified volatility curve. Accordingly, if you edit the skew for a certain width and then change the width displayed, the system automatically displays the skew for the new width from the system's default volatility surface.
In the Portfolio page any changes you make to the volatility curve for a single instrument only affect the subsequent pricing of that instrument. Accordingly you can create a different volatility curve for each instrument in the Portfolio page, even if each instrument has the same expiry and swap tenor.
If you modify the volatility skew data you will not then be able to update the market volatility or the market normal volatility (these buttons in the Results area will be removed) until you restore the use of the system's volatility curve. To restore the system’s curve see Restoring the System’s Volatility Curve.
If you edit the volatility surface for an instrument and then subsequently save that instrument, it is important to note that the edited volatility surface is not saved with it. That is, when you next access this instrument, it will be displayed with the current data from the system's volatility surface.
The volatility skew data for the BRL currency cannot be edited.
To edit the volatility rate for a certain width for the payer and/or receiver:
| 1. | Decide if you want to define the volatility as a spread from the ATM or as an absolute value using the Vol Spread vs. ATM toggle button. |
| 2. | For the payer/ receiver first select the width for which you want to edit the volatility rate. |
| 3. | Edit the rate. After changing the rate, you will then need to click the Calculate button to instruct the system to calibrate a new volatility curve, i.e., for use with the defined expiry and tenor only, and to see the affect this change has on any related volatilities. |
Restoring the System’s Volatility Curve
After making any changes to the volatility curve for the current instrument you can then remove these changes, and instruct the system to use the default volatility surface.
To remove any edited changes and restore the system’s volatility curve you can:
Click the Refresh Rates button.
In either of the Vol fields delete the edited data and then click outside the field or press <Enter> on the keyboard.
The system then displays the system’s volatility skew data.