Once you have loaded the strategy to the Risk Matrix window, for the defined valuation date you can then simulate how changes to any one or two of the following market data inputs will affect the position of that strategy1:
Spot (this is the future price or swap price).
Volatility.
IR yield curve.
FX spot—depending of course on the instrument(s) in the current strategy.
Note that the FX spot can only be shifted if the strategy contains one or more instruments for which you have changed the base currency and if you have defined it as a quanto version of that instrument (and not as a composite version). If you do shift the FX spot, the shift in the FX spot has no effect on the premium of the instrument across the risk matrix (this is because this type of instrument uses a predefined FX exchange rate and is therefore not sensitive to exchange rate risk), but does affect the Greeks.
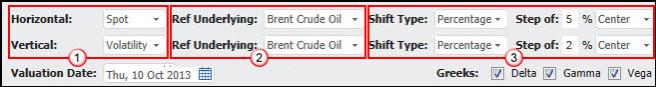
You do this by linking an element to the horizontal axis and, optionally, one to the vertical axis (as seen at 1 in Figure 1).
For each axis—the horizontal or the vertical—you can then also:
Define the asset to which the shift in the market data element relates (from the assets included in the current strategy) using the Ref Underlying fields as seen at 2 in Figure 1.
Control the shift.
Depending on the defined element you can choose between any of the following:
Absolute
The element is shifted by the defined amount.
Percentage
The element is shifted by the defined percentage.
This option is not supported for a shift in the yield curve element.
Pips
The element is shifted by the defined number of pips.
This option is only supported for a shift in the FX spot rate element.
StDev (or standard deviation)
The element is shifted by the standard deviation which is calculated as volatility/16 (with the calculated result being treated as a percentage). This shift is actually calculated individually for each contract in the term structure, that is, for each contract SD works out its own StDev (the volatility of that contract/16) and then shifts the future price for that contract by that percentage.
This option is only supported for a shift in the spot element.
Once you have done this, you can then also control how this shift is applied across the relevant curve itself (as described in Controlling How the Defined Shift Is Applied Across the Curve in the Risk Matrix) and, if multiple assets are included in the current strategy, how the defined shift affects those other assets, if at all (as described in Working with the Correlation Setting in the Risk Matrix).
Control the steps, both the increments between them and the point around which each matrix should be created, using the Shift Type and Step of fields as seen at 3 in Figure 1.
All the steps on a single axis are changed by the same increment.
Figure 1: Defining the Element to be Shifted
|
|
When you have defined the horizontal axis and, optionally, the vertical axis, you must first apply the changes to the table itself being calculating the Risk Matrix. You do this using the Generate Table button. |
The flexibility supported in the definition of each axis lets you investigate, for example, what would happen if the same element changed for two assets (e.g., if the spot changed for both Brent Crude Oil and for Gas Oil, as seen in Figure 2) or if two different elements changed for the same asset (e.g., the spot and the IR yield curve changed for Brent Crude Oil).
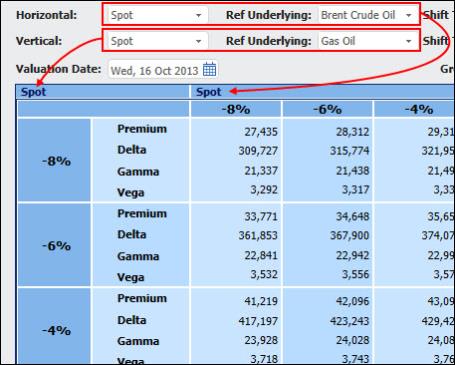
Figure 2: Investigating What Will Happen If the Same Element Is Changed for Two Assets
To change the market data on each Risk Matrix axis:
| 1. | In the Risk Matrix click the Horizontal or Vertical dropdown list. |
| 2. | Select the market data you want to change at each step and define the steps, as well as the correlation and curve settings if relevant. |
| 3. | Click the Generate Table button to see the change in the Risk Matrix. |