This topic provides an overview of working with back testing in SDX Commodities & Energy.
It covers the following topics:
See "How Back Testing Is Carried Out in SDX Commodities & Energy "
See "Activating Back Testing in SDX Commodities & Energy"
See "What Back Testing Data Is Displayed in SDX Commodities & Energy?"
Back testing is the process of evaluating a strategy by looking at its return over a series of historical dates using real (i.e., historical) data. This lets you see how a strategy would have performed in past markets if it had actually been entered into in the past.
Although such a tool can never actually prove a theory correct (because past results do not necessarily indicate future results), it can be a useful tool of analysis and prediction. In addition, its use of actual historical market data lets you better analyze a strategy as it encountered real-world conditions in the past.
The success of this tool depends on its ability to accurately replicate past conditions, and so it is essential to have access to reliable and clean market data for the historical dates in question.
How Back Testing Is Carried Out in SDX Commodities & Energy
Back testing is supported in SDX Commodities & Energy for a defined period up to and including the current date (a period that is referred to as the back testing period).
It is supported in the Single Option page for the following instruments:
Vanilla
Vanilla strategies
Vanilla strip
Vanilla strip strategies
Swap
Swap strip
Forward
Forward strip
Asian
Asian strip
Asian strip strategies
Basket
To perform back testing the system in effect simulates a series of replicate instruments, each of which expires on a subsequent business date in the back testing period. Because the system keeps a constant time to maturity for each of the replicated instruments (i.e., it assumes that the number of days in each replicate instrument is the same as the number of days in the original instrument) it defines each replicated instrument's trade date as follows:
Replicated instrument's expiry date - no. of days in the original instrument
For each of these replicate instruments the system then calculates its payout. So for example, on 29 September 2010 you price a 1-year vanilla on Brent Crude Oil and you choose to back test it for a period of 5 years, i.e., from 29 September 2005 to the current date. The system will then calculate the payout for a 1-year vanilla on Brent Crude Oil that expires on 29 September 2005, for a 1-year vanilla on Brent Crude Oil that expires on 30 September 2005, for a 1-year vanilla on Brent Crude Oil that expires on 1 October 2005, etc., up to and including 29 September 2010.
When calculating the payout of each replicate instrument:
The system uses the relevant market data.
For each replicate instrument the system uses the end-of-day market data saved in the system for the relevant trade date and expiry date.
|
|
Depending on the market data available, the system may shorten the back testing period as necessary. For:
|
The system takes into account any relevant events, such as fixing dates for Asians.
If it is an American style instrument (that can be exercised by the buyer of the instrument at any time), the system assumes that it will not be exercised before its expiry date. That is, it treats it as a European style instrument.
The payouts are displayed as a percentage. For a single instrument this is calculated as the cash payout / notional. For a portfolio, the system shows the payout for each instrument individually (i.e., its cash payout / notional) as well as for the portfolio as a whole (i.e., the cash payout of all the legs / notional of the first leg).
Activating Back Testing in SDX Commodities & Energy
After defining the instrument for which you want to carry out back testing in the Single Option page, you access the Back Testing Charts window (where you define the back testing period and see the generated results) on the ribbon bar by:
Clicking the Trader tab | Back Testing button.
Clicking the Structurer tab | Back Testing button.
Clicking the Sales tab | Back Testing button.
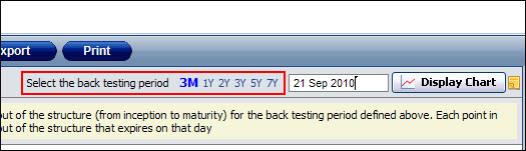
By default the system automatically sets the back testing period to three months, but you can edit it either using the period shortcuts in the page-3m, 1y, 2y, 3y, 5y & 7Y, as seen in See "Selecting the Back Testing Period ", or by manually entering a date in the field itself.
Figure 1: Selecting the Back Testing Period
To activate the back testing feature:
| 1. | In the Single Option page enter the instrument. |
| 2. | On the ribbon bar in the Sales tab, the Trader tab or the Structurer tab click the Back Testing button. The Back Testing Charts window opens. |
| 3. | Edit the back testing period by clicking one of the date shortcuts or by manually defining its start date in the field. |
| 4. | To generate a chart click the Display Chart button. A chart is displayed in the main area; on the right hand side the distribution & cumulative histograms are displayed together with the statistics. |
| 5. | In the Yield Statistics area change the yield brackets as required and then click Apply to see the changes in the histograms. |
| 6. | To export the data to an Excel spreadsheet click the Export button. |
What Back Testing Data Is Displayed in SDX Commodities & Energy?
After carrying out back testing for the instrument defined in the pricing page for a defined period you can then see the results in a number of formats:
In a chart format
In the form of statistics
In an Excel spreadsheet
In the form of distribution & cumulative histograms
Viewing the Back Testing Data In a Chart Format
In the generated chart you can see the following information (and as seen in See "Viewing the Back Testing Data in a Chart Format "):
Performance of each relevant underlying asset on each expiry date. This is calculated as Spot on the expiry date / initial spot - 1
Payout of the instrument(s) for each expiry date. For a portfolio you see the data for each instrument individually and for the portfolio as a whole.
Zero level. This shows where the 0 level of the payoff is to be found.
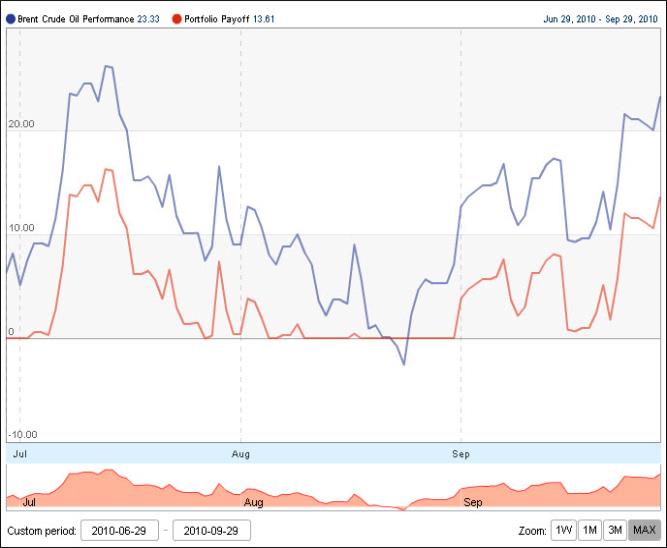
Figure 2: Viewing the Back Testing Data in a Chart Format
This chart was generated for the instrument as defined in See "Instrument Defined for the Back Testing Chart in Figure 2 ".
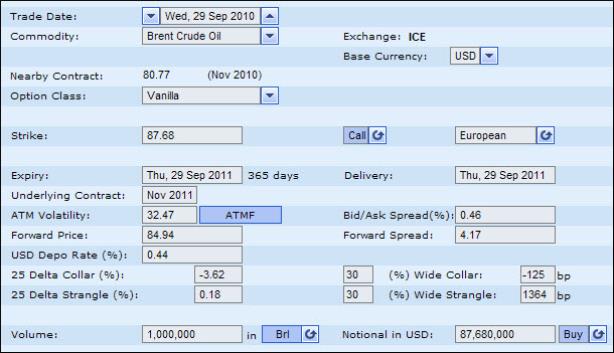
Figure 3: Instrument Defined for the Back Testing Chart in Figure 2
To access the data in a chart format, after defining the begin date you click the Display Chart button.
Once the system has generated the chart you can then work with it.
Viewing the Back Testing Data in a Statistical Format
In the Payoff Statistics area you can see the following data (and as seen in See "Viewing the Back Testing Data in a Statistical Format "):
Minimum payout
Maximum payout
Average of all the payouts
Standard deviation of the payouts
To access this data, after defining the begin date you click the Display Chart button.
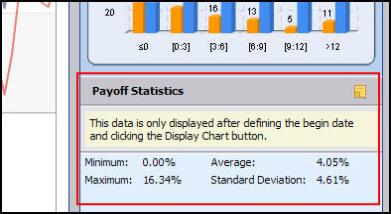
Figure 4: Viewing the Back Testing Data in a Statistical Format
Viewing the Data in an Excel Spreadsheet
You can access the back testing data in an Excel spreadsheet.
To access the data in an Excel spreadsheet:
After defining the begin date you then click the Export button. Alternatively, you can click the Export button after clicking the Display Chart button.
Viewing the Data in the Form of Distribution & Cumulative Histograms
In addition to seeing the results in a chart format and a statistical format, you can also see the annual yield (which is the annual rate of return on an investment, expressed as a percentage) in a histogram format as seen in See "Statistics in the Back Testing Tool ".
What is a histogram? A histogram is a bar chart representing a frequency distribution, where each bar represents the observed frequencies in a particular category. That is, you see what proportion of cases fall into each of several categories.
The back testing tool in SDX Commodities & Energy displays two types of histogram:
Distribution histogram
This shows the annual return.
Cumulative histogram
This shows the cumulative annual return, where the results are accumulated from the top to the bottom.

Figure 5: Statistics in the Back Testing Tool
In the SDX Commodities & Energy back testing tool each category is a defined range of yield. So you can see the yield that is less than a given percentage, the yield between a range of percentages, and the yield over a given percentage. By default the system defines these categories, but you can easily edit them as required in the Define Annualized Yield Brackets area.
To customize the yield range for each category, simply edit the required value and then click the Apply button. The system automatically recalculates the histograms accordingly.