This topic deals with working with the generated charts in the Back Testing tool and the Historical Analysis page.
Once the system has generated a chart (whether in the Back testing tool or in either of the Historical Analysis pages) it displays:
The plotted data.
A scroller area (at the bottom of the main chart), which is a simplified representation of the entire data set. This area is used by the viewer to move back and forth through the data set.
In the generated chart you can then do any of the following:
Choose which data elements to include in the chart according to your needs.
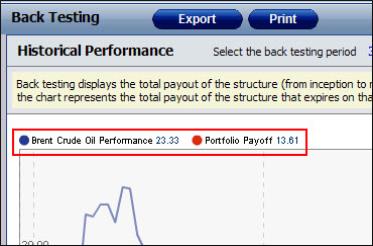
You can choose to include any or all of the relevant elements to include. So in the Historical Analysis page you can choose which elements to include; in the Back Testing chart you can choose to include either or both of the following elements—the performance data for each underlying element and the payoff data for the instrument.
You do this using the icon next to each element, as seen in See "Choosing Which Data Elements to Include in the Back Testing Chart ". Clicking the colored dot next to an element immediately removes that element from the chart, and the dot itself is replaced by an X. Clicking the X immediately returns that element to the chart.
| Figure 1: | Choosing Which Data Elements to Include in the Back Testing Chart |
Mouse over the chart to see the actual performance and payoff on each date you point at.
As you move the mouse over the chart, the results for each displayed element are updated and the date range for which the results are shown is displayed on the top right of the chart. Whether you see the results for a day, week or month depends on the back testing period chosen, the zoom chosen and on the range displayed. However, note that if you see the results for a week or month, the system displays the results for the last day of the period displayed.
Zoom in on a period of particular interest.
You do this by defining the period to display. You can do this in a number of ways:
Using the Zoom tool. This lets you select a period to display that is measured backwards from the current date. So if the current date is 29 September 2010 and you select 1m, you will see the period from 30 August 2010 to 29 September 2010. The actual dates of the period shown is noted in the Custom Period fields.
As seen in See "Using the Zoom Tool to Display a Period in the Back Testing Chart " the range of the period selected (relative to the entire back testing period) is indicated in the scroll area (as seen in 1).
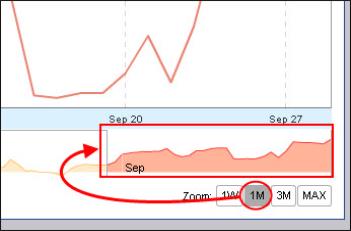
| Figure 2: | Using the Zoom Tool to Display a Period in the Back Testing Chart |
Defining the period to display (or zoom in on) directly in the Custom Period fields.
You can define the period directly in the Custom Period fields (as seen in See "Using Custom Period Fields to Define a Period in the Back Testing Chart "). Again, if you do this you can always see the period selected relative to the entire back testing period in the scroll area.
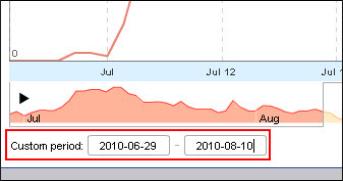
| Figure 3: | Using Custom Period Fields to Define a Period in the Back Testing Chart |
Defining the area to display in the scroll area.
If you have defined a period range, click in between the icons (as seen in See "Using the Scroll Area to Define a Period in the Back Testing Chart ") and then drag to retain the period size and apply it to a different section of the entire back testing area. Again you see the period displayed in the Custom Period fields.
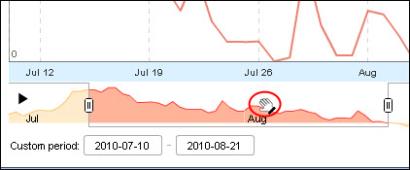
| Figure 4: | Using the Scroll Area to Define a Period in the Back Testing Chart |
Alternatively, click the actual scroll icon (as seen in See "Using the Scroll Icon to Define a Period in the Back Testing Chart ") and drag to define the area of the entire back testing period to display.
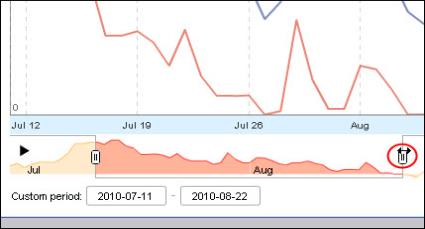
| Figure 5: | Using the Scroll Icon to Define a Period in the Back Testing Chart |
Play through the entire data set.
You can instruct the system to automatically scroll over the entire data set displayed in the chart.
You do this by clicking the black play button in the scroller (as seen in See "Playing Through the Entire Data Set in the Back Testing Chart "). As it scrolls through the data set (one day at a time), each time it displays the period defined using the scroll icons.
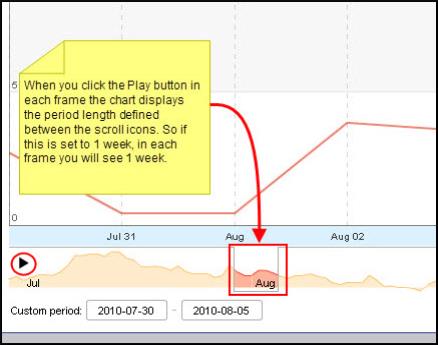
| Figure 6: | Playing Through the Entire Data Set in the Back Testing Chart |