In SDX Interest Rates you can carry out back testing in the Back Testing Charts window. For more information see What Is Back Testing?
After defining the instrument for which you want to carry out back testing in the Single Option pricing page, you access the Back Testing Charts window (where you see the generated results and you can edit the back testing period) in one of a number of ways:
Clicking the Back Testing button in the Trader tab or Sales tab | or Structurer tab.
Clicking the Back Testing tab on the left hand side of the pricing page.
At the top of the page you can see a summary of each instrument that will be back tested when you click the Display Chart button. This is a summary of each instrument defined in the pricing page. If the strategy contains more than two instruments, you must click the View button to see all its instruments.
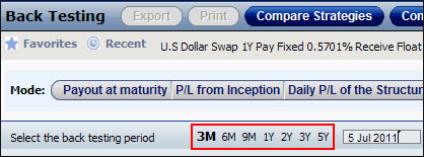
By default, the system automatically carries out back testing on the defined instrument for a period of 3 months. However, you can edit the back testing period:
Using the period shortcuts in the page—3m, 6m, 9m, 1y, 2y, 3y or 5y—as seen in Figure 1.
By manually entering the required start date in the text box as seen in Figure 1.

Figure 1: Selecting the Back Testing Period
For more information on:
The displayed results see What Back Testing Data Is Displayed in SDX Interest Rates?
Comparing Strategies in the Back Testing Page
Comparing Legs in the Back Testing Page
Accessing Recently Calculated Strategies in the Back Testing Page
Using the Favorites List in the Back Testing Page
To activate the back testing feature:
| 1. | In the pricing page enter the instrument(s). |
| 2. | In the relevant tab (Trader, Sales or Structurer), click the Back Testing button. Alternatively, click the Back Testing tab on the left hand side of the pricing page. |
The Back Testing Charts window opens and displays the back testing data for the defined instrument for a three-month period—a chart is displayed in the main area and on the right hand side the distribution & cumulative histograms are displayed together with the statistics.
| 3. | If required do any of the following as required: |
Edit the back testing period by clicking one of the period shortcuts.
Edit the calculation mode.
Edit the annualization setting.
| 4. | Then click the Display Chart button to generate the data for the edited back testing period. |
| 5. | In the Yield Statistics area change the brackets as required and then click Apply to see the changes in the histograms. |
| 6. | To export the data to an Excel spreadsheet click the Export button. |