The Gamma Ladder window, which is accessed via the Risk Matrix Window, lets you see how on the current date the market value, DV01 and the Gamma risks1 in the portfolio change for parallel shifts of the curves which contribute to the interest rate risk, including the discounting curve.
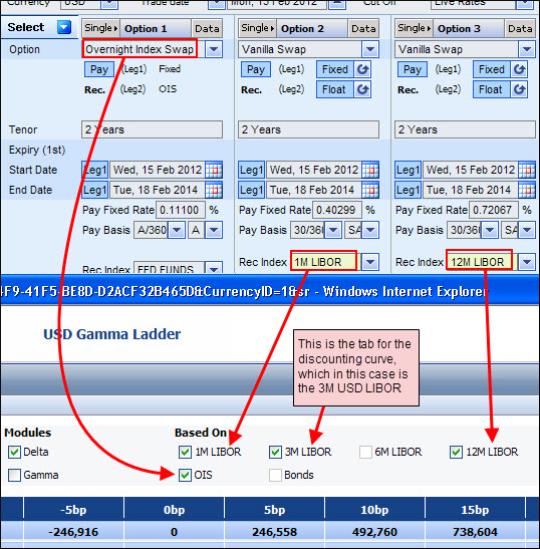
By default the risks are displayed for all of the underlying contributing curves together. This includes the discounting curve (which is either the default Libor yield curve or the OIS curve); which other curves are included depends on both the instruments in the portfolio and on their definitions. For example if the portfolio includes a vanilla swap based on the 1M USD LIBOR index and a vanilla swap based on the 6M USD LIBOR index and the discounting curve is set to the default Libor curve, then in addition to the default 3M USD Libor yield curve the Gamma Ladder will also include a tab for the 1M LIBOR and the 6M LIBOR, as seen in Figure 1.
You can then manually control for which curves the risks are displayed using the Based On checkboxes.
Figure 1: The Gamma Ladder Window
For more information on:
The market data used in the Gamma Ladder see What Market Data Is Used in the Gamma Ladder Window?.
What you can do in the Gamma Ladder see What Can You Do in the Gamma Ladder Window?.
To access the Gamma Ladder window:
From the Risk Matrix window click the Gamma Ladder button.
|
|
This button is not enabled in the Others tab in the Risk Matrix window. |
From the Single Option page click the DV01/Gamma Buckets button that appears in the Results area for a supported instrument and then in the Risk Matrix window click the Gamma Ladder button.
|
|
When you click the DV01/Gamma Buckets button in the Single Option page if necessary the system calculates the results on-the-fly. That is, you do not need to calculate the instrument before clicking the button. |
What Market Data Is Used in the Gamma Ladder Window?
By default the system calculates the results using the market data in the page from which the Gamma Ladder window was opened, i.e., the Risk Matrix window. In addition, note that the same volatility surface is used at each yield curve scenario.
|
|
|
What Can You Do in the Gamma Ladder Window?
In the Gamma Ladder window you can:
Shift the curves data, i.e., the yield curve and the OIS curve.
Choose to see the Gamma Ladder for any or all of the contributing curves together.
|
|
By default you see how the total DV01 and gamma risks in the portfolio change for parallel shifts of all the contributing curves together. |
You do this by checking the relevant Based On checkboxes. After changing for which curves you want to see the results, you must then click Calculate to apply those changes.
Decide for which risk elements (DV01 and/or Gamma) you want to see the results.
You control this using the Delta and Gamma checkboxes.
|
|
By default only the DV01 results are displayed. |
You can customize the display of the displayed ladder.
You do this in the Grid Settings window which is accessed by clicking the Grid Settings button.
In the Grid Settings window the:
Scenarios dropdown list lets you control how many columns (each representing a shift in the yield curve) are displayed.
Step dropdown list lets you control the increment between each step.
Export the data in each curve’s tab to an Excel spreadsheet.
Shifting the Curves Data in the Gamma Ladder Window
In the Gamma Ladder window you can shift the curves data (i.e., the yield curve and the OIS curve) at the “zero” step in the ladder up or down by the same number of basis points to see how this change affects the various risks of the current option/portfolio.
Once you have done this, all other steps in the ladder are then shifted relative to the new zero step.
You make this change using the Shift Curves By textbox as seen in Figure 2.
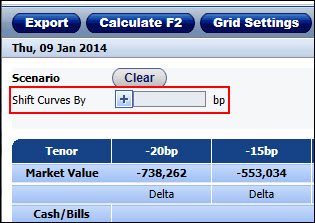
Figure 2: Shifting the Curves Data Used in the Gamma Ladder
In the Gamma Ladder window, you can also remove any manual shifts made to the market data used in this window (this includes any manual shifts made directly to the curves data in this window, or to the volatility surface and/or curves data made in the Risk Matrix window before you opened the Gamma Ladder window). You do this by clicking the Clear button.
Clicking the Clear button also automatically recalculates the results displayed in this window using the market data from the page from which the Gamma Ladder window was opened.
To shift the curves data in the Gamma Ladder:
| 1. | In the Shift Curves By textbox enter the amount in basis points by which you want to shift the zero step in the ladder. |
| 2. | Click Calculate. The system shifts the yield curve and the OIS curve at the zero step and then shifts all other steps in the ladder accordingly. |
Exporting a Curve’s Gamma Buckets Data to Excel
You can export the data in each tab in the Gamma Ladder window to an Excel spreadsheet.
To export the curve’s data from the Gamma Buckets window to Excel:
| 1. | In the Gamma Ladder window in the relevant tab click the Export button. |
| 2. | In the File Download window click Open or Save as required. |