When defining an instrument or portfolio, it is useful to know what the risks are for a given scenario across buckets.
In the Risk Matrix window for an instrument or portfolio you see the following risk—its market value and the DV01 and the Gamma1.
The DV01 and the gamma risks are displayed across the relevant curves for a variety of tenors2 in a number of tabs—the Interest Rate tab (this tab is displayed for the deal or portfolio currency and for each additional currency in a multiple currency deal) and the Others tab.
|
|
Which tabs are included depends on the instrument or the instruments in the portfolio. |
In the:
Interest Rate tab the DV01 risk and the gamma risk is shown for each interest rate curve individually and as a total exposure across all the interest rate curves, in both cases for a variety of tenors3.
|
|
This tab is displayed for the deal or portfolio currency and for each additional currency in a multiple currency deal. So for example, if a USD portfolio contains a USD/JPY cross currency swap, the DV01 and Gamma risks for the USD currency will be displayed in the Interest Rate tab, and the DV01 and Gamma risks for the JPY currency will be displayed in the JPY Interest Rate tab. If you have a number of instruments with two currencies (e.g., cross currency swap, UDI swap, UF swap, quanto swap, etc.), each individual currency is contained in its own <CCY> Interest Rates tab. |
The interest rate curves consist of the LIBOR yield curves, the OIS curve, the short term interest rate (STIR) futures and the Government Bonds curve. Whether or not the system shows the risk for a particular curve depends on the instruments in the portfolio.
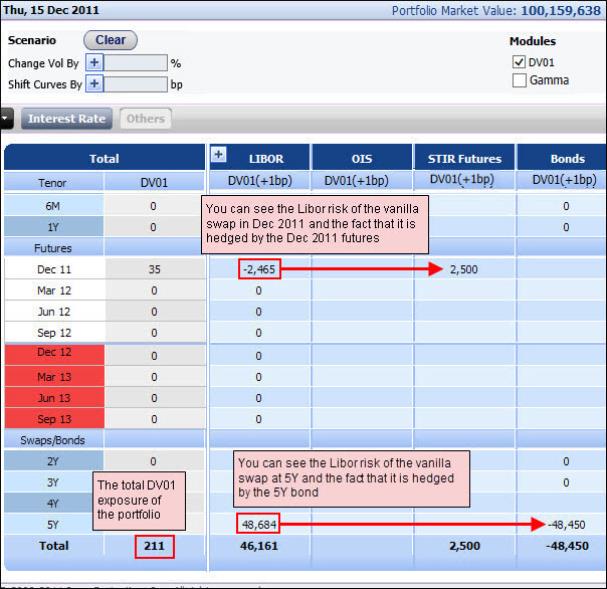
Being able to see the risk distributed across the individual curves and across the tenors lets you fully understand your risk in great detail. In addition, being able to see the total exposure lets you see, for example, the total exposure for a hedged portfolio. An example of this is shown in Figure 1 where the portfolio consists of a 5Y vanilla swap and the futures contract and the bond used to hedge it (you can see the actual portfolio in Figure 2).
You see the risks across several columns—LIBOR (this column is displayed as total and, if you click the + icon, across the underlying indexes—1M, 3M, 6M and 12M), OIS, STIR (Short Term Interest Rates) Futures and Bonds.
Figure 1: Risk Matrix Window for the Portfolio Seen in Figure 2
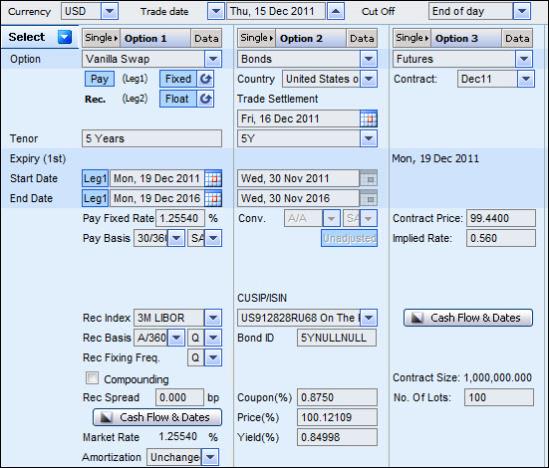
Figure 2: Example of a Portfolio That You Want to View in the Risk Matrix
Others tab the DV01 risk and the gamma risk is shown for all the relevant curves which are not interest rate curves, i.e, for the inflation curve, the BMA curve and the basis swaps curve4, for a variety of tenors.
This tab is only active if the instrument in the Single Option page is one of the following instruments or if the portfolio holds one or more of the following instruments—cross currency swap, inflation swap and BMA swap.
In addition, a curve is only included in this tab if it is used to calculate the instrument or portfolio. That is, you only see the inflation curve for an inflation swap, you only see the BMA curve for a BMA swap, etc.
What does each displayed value in any of the tabs mean? Each value means that this is the amount the portfolio’s market value will change if only the rate for the given tenor is shifted by the defined amount for that Greek. So for example, in the Interest Rate tab, if for the 5Y tenor the DV01 amount for the Libor curve is 48,684, this means that the portfolio’s market value will increase by 48,684 dollars if only the 5Y rate in the yield curve is shifted by the amount defined in the system for the DV01.
The following topics are also available:
What Market Data Is Used in the Risk Matrix Window?
What Can You Do in the Risk Matrix Window?
To access the Risk Matrix window:
From the Portfolio page enter a new portfolio or open an existing one. Then in the Trader tab or the Structurer tab or, from the Portfolio page only, in the Sales tab, click the Risk Matrix button. The Risk Matrix window opens for the current portfolio.
For supported instruments in the Single Option page click the DV01/Gamma Buckets button which directly opens the Risk Matrix window.
|
|
When you access the Risk Matrix, if necessary the system calculates the results on-the-fly. That is, you do not need to calculate the instrument/portfolio before opening it. |
What Market Data Is Used in the Risk Matrix Window?
By default the system calculates the results displayed in the Risk Matrix using the market data from the pricing page from which the Risk Matrix window was opened. To be more exact, the market data used is the market data that was used in the last calculation in that pricing page before you loaded the strategy to the Risk Matrix.
Once the Risk Matrix window is opened:
Any changes you make to the market data in the source window (i.e., either of the pricing pages) do not affect any open Risk Matrix window. However, if in the system you edit any relevant yield curves and/or volatility surfaces, these changes do affect the open Risk Matrix window. But you will need to close the window first and re-open it to see the changes.
In the Risk Matrix window itself you can then easily shift the underlying volatility surface and/or the curves data (i.e., the yield curve and the OIS curve), thereby letting you see what the market value, DV01, Gamma and vega of the option or portfolio would be if the market data was to change. This lets you easily perform What-if analyses in a risk-free environment.
What Can You Do in the Risk Matrix Window?
In the Risk Matrix window you can:
Access the results for the different groups of curves. You do this simply by clicking the relevant tab:
Interest Rate
Others
<CCY> Interest Rate
Decide for which risk elements (DV01 and/or Gamma) you want to see the results.
You control this using the DV01 and Gamma checkboxes.
|
|
By default both the DV01 and the gamma results are displayed. |
Shift the volatility surface and/or the curves data used to calculate the market value, DV01 gamma and vega results, and, subsequently, remove any manual shift applied earlier in the current session.
See the vega amount of the portfolio as it is distributed across the appropriate time buckets. You do this in the Vega Buckets Window which is accessed by clicking the Vega Buckets button.
See what happens to the DV01 and/or gamma risks of the portfolio if the yield curve was to change. That is, you can simulate how changes to the relevant curves will affect the position of an existing portfolio, and so plan your strategies in a risk-free environment.
You do this in the Gamma Ladder Window which is accessed by clicking the Gamma Ladder button.
Export the results in each tab in the Risk Matrix to Excel.
Shifting the Volatility Surface and the Curves in the Risk Matrix
By default the system calculates the risk displayed in the Risk Matrix using the market data in the page from which the Risk Matrix window was opened. To be more exact, the market data used is the market data that was used in the last calculation in that pricing page before you loaded the strategy to the Risk Matrix
In the Risk Matrix itself you can then easily shift either or both of the following:
Volatility surface
You can shift the volatility surface up or down by the same percent to see how this change affects the various risks of the current option/portfolio.
Any shift affects both the cap/floor volatility surface and the swaption volatility surface.
You do this entering a value in the Change Vol By field, using the + <> - toggle button to indicate if you want to shift the rates up or down, and then clicking the Calculate button.
Curves data
You can shift the curves data (which is both the yield curve and the OIS curve) up or down by the same number of basis points to see how this change affects the various risks of the current option/portfolio.
You do this entering a value in the Shift Curves By field, using the + <> - toggle button to indicate if you want to shift the rates up or down, and then clicking the Calculate button. The value can be a whole number or less than a whole number, e.g., 0.34.
This lets you see what would happen to the market value, the DV01, the gamma and the vega of the option/portfolio if the market data was to change.
You shift the selected data up or down by the same percentage or amount at each tenor. After you edit the volatility surface or the curves data, it is then noted in the page by how much you shifted it.
Note that any shift you make is retained during the current session. That means that if you shift the rates and then later in the same session you shift the rates again, this latter shift is added to any previous shift(s) already made in the session. In addition, in the page the total amount by which you have shifted the rates in the current session is noted.
|
|
Any change to the volatility surface or the curves data that you make in the Risk Matrix window affects the calculation of the risk in this window and in any window subsequently opened from it, i.e., the Gamma Ladder and the Vega Buckets window. However, the edited data will not be used in any Gamma Ladder or Vega Buckets window that is already open when you make the market data changes. In addition, the edited market data is only used until you close the Risk Matrix window. |
Once you have shifted the market data in the Risk Matrix window, you can then remove any manual shifts you have made in the current window from the volatility surface and/or curves. You do this by clicking the Clear button.
Clicking the Clear button also automatically recalculates the results using the Risk Matrix window’s original market data, i.e., the market data from the time of the last calculation in the pricing page before you loaded the strategy to the Risk Matrix.
To shift the volatility surface or the yield curve and OIS curve to be used in the Risk Matrix window:
| 1. | In the Risk Matrix in the relevant field (Change Vol By or Shift Curves By) use the + <> - toggle button to indicate if you want to shift the market data up or down. |
| 2. | As relevant, define the percentage or the number of basis points by which you want to shift the volatility surface or the yield curve and the OIS curve. |
| 3. | Click Calculate. The volatility surface or the yield curve and OIS curve are edited (and it is noted in the page that you have moved that market data by the defined amount) and the results are recalculated using the shifted market data. |
Exporting the Risk Matrix Data to Excel
You can export the data in each tab in the Risk Matrix to an Excel spreadsheet.
To export the data in a tab in the Risk Matrix to Excel:
| 1. | In the Risk Matrix window in the relevant tab click the Export button. |
| 2. | In the File Download window click Open or Save as required. |