The Vega Buckets window shows the Vega amount (i.e., the change in the portfolio’s market value for a defined percentage change in the volatility surface1) as it is distributed across the appropriate time buckets.
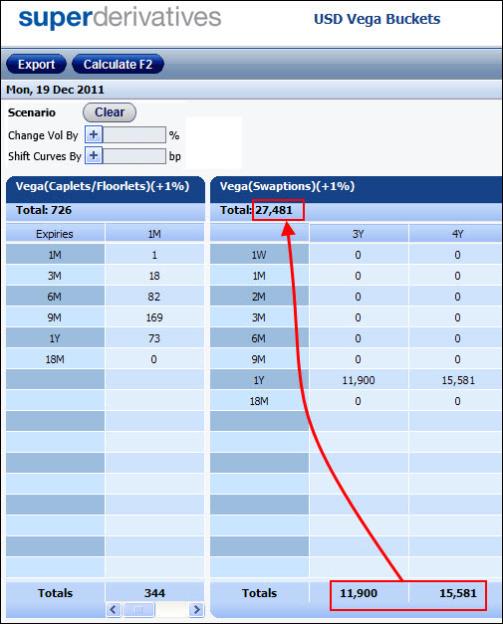
As seen in Figure 1 the system displays the portfolio’s vega amount separately for the:
Cap/floor volatility surface
The vega is displayed separately for each underlying Libor index in the portfolio, and as a total for all the underlying Libor indexes.
Within each underlying Libor index, the vega is displayed for each relevant time bucket and as a total across all the time buckets.
Swaption volatility surface
The vega is displayed separately for each underlying swap tenor in the portfolio and across the various time buckets (which represent the option expiries).
Figure 1: The Vega Buckets Window
It can be accessed via the Risk Matrix Window or via the Single Option page using the Vega Buckets button.
To access the Vega Buckets window:
From the Risk Matrix Window by clicking the Vega Buckets button.
From the Single Option page by clicking the Vega Buckets button that appears in the Results area for supported instruments.
|
|
When you click this button in the Single Option page if necessary the system calculates these results on-the-fly. That is, you do not need to calculate the instrument before clicking the button. |
What Market Data Is Used To Calculate The Vega?
By default the system initially calculates the vega results in the Vega Buckets window using the market data in the page from which the Vega Buckets window was opened, i.e., the Risk Matrix window or the Single Option page.
|
|
If it was the Single Option page, then the market data used is the market data that was used in the last calculation in that pricing page before you loaded the strategy to the Vega Buckets window. If it was the Risk Matrix page, then if the market data in the Risk Matrix page was manually shifted before you accessed the Vega Buckets window, this is noted in the Vega Buckets window as well. |
In the Vega Buckets window, you can also remove any manual shifts made to the market data used in this window (this includes any manual shifts made directly to the volatility surface and/or curves data made in the Risk Matrix window before you opened the Vega Buckets window). You do this by clicking the Clear button.
Clicking the Clear button also automatically recalculates the results in displayed in this window using the market data from the page from which the Vega Buckets window was opened.
Once the window is opened:
Any changes you make to the market data in the source window (either the Risk Matrix window or the Single Option page) do not affect any open Vega Buckets window. However, if in the system you edit any relevant yield curves and/or volatility surfaces, these changes do affect the open Vega Buckets window. But you will need to close the window and re-open it to see the changes.
In the Vega Buckets window itself you can then easily shift the underlying volatility surface and/or the curves data, i.e., the yield curve and the OIS curve, thereby letting you see what the vega of the portfolio would be if the market data was to change. This lets you easily perform What-if analyses in a risk-free environment.
What Can You Do in the Vega Buckets Window?
In the Vega Buckets window you can:
Shift the volatility surface and/or the curves data used to calculate the vega amount.
Export the vega results to Excel
Shifting the Volatility Surface and the Curves in the Vega Buckets Window
In the Vega Buckets Window itself you can easily shift either or both of the following:
Volatility surface
Any shift affects both the cap/floor volatility surface and the swaption volatility surface.
To shift the volatility surface, you first instruct the system by what percentage to shift the ATM log normal volatility at each expiration/swap duration point. When you apply this change, after shifting each ATM log normal volatility point by the defined percentage the system then adjusts the rest of the volatility surface accordingly.
Curves data
Any shift affects all of the following—the Libor yield curve and the OIS curve.
This lets you see what the vega of the portfolio would be if the market data was to change.
After you edit the volatility surface or the curves data, it is noted in the page by how much you have shifted it.
Note that any shift you make is retained during the current session. That means that if you shift the rates and then later in the same session you shift the rates again, this latter shift is added to any previous shift(s) already made in the session. In addition, in the page the total amount by which you have shifted the rates in the current session is noted.
|
|
Any change to the volatility surface or the curves data via the Vega Buckets window only affects the calculation of the vega in this window. In addition, the change is only used until you close the window. |
To shift the volatility surface or the curves data to be used in the Vega Buckets window:
| 1. | In the relevant field (Change Vol By or Shift Curves By) use the + <> - toggle button to indicate if you want to shift the market data up or down. |
| 2. | As relevant, define the percentage or number of basis points by which you want to shift the volatility surface or the curves data. |
| 3. | Click Calculate. The volatility surface or curves data is edited and it is noted in the page that you have moved it by the defined amount. |
Exporting the Vega Buckets Data to Excel
You can export the data in the Vega Buckets window to an Excel spreadsheet.
To export the data in the Vega Buckets window to Excel:
| 1. | In the Vega Buckets window click the Export button. |
| 2. | In the File Download window click Open or Save as required. |