In the Historical Analysis Page in Section 1 you work with your time series definitions.
By default when you access the page, the system fills in the default asset (i.e., the asset from whose pricing page you accessed this page) and the default underlying. For:
SDX Foreign Exchange, SDX Interest Rates, SDX Commodities & Energy and SDX Equities the default underlying is taken from which you accessed this page.
However, this is only true if the pricing page contains a single asset instrument. If it contains an instrument with multiple assets (e.g., a basket) then the underlying asset in the Historical Analysis page is blank.
For SDX Credit Derivatives the default underlying asset is always set to the first in the list of underlying assets in the pricing page itself.
You can create new time series definitions and delete existing ones.
Once you have created one or more time series definitions you can then:
Create charts for them in any combination (see Displaying Charts Of Historical Market Data)
Use them in the correlation definitions in Section 2 (Working With Correlation Definitions)
Use them in the formula definitions in Section 3 (see Working With Formulas)
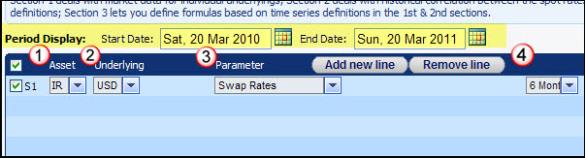
Each time series consists of the following elements (and as seen in Figure 1):
The defined period
This is defined using the Start Date and End Date fields. For more information on defining this period see Defining the Chart Period Definition.
The asset (1)
You can choose any of the supported assets—FX, IR, CM, EQ, CD.
In FX this is the currency pair, in IR this is the currency, in CM this is the asset, in EQ it is the stock or index, in CD it is a single name, index or tranche.
The market data, or parameter, (3) and, if relevant, the parameter definition (4)
For more information on which parameters are available for each asset click the relevant link:
FX asset (see What FX Historical Data Can You Chart? )
IR asset (What IR Historical Data Can You Chart? )
CM asset (What CM Historical Data Can You Chart? )
EQ asset (What EQ Historical Data Can You Chart?)
CD asset (What CD Historical Data Can You Chart?)
|
|
In CD you do not choose the parameter. By default the system plots either historical CDS spreads (i.e., the market value) or upfront fee, as relevant for the defined underlying. |
You create each time series definition by working from left to right across the page as seen in Figure 1.
Figure 1: The Order for Defining a Time Series Definition
You can also use the keyboard to define the time series. For more information see Using the Keyboard.
To add a new time series:
| 1. | In the Historical Analysis page in Section 1 click the Add New Line button. |
| 2. | Define the asset, underlying, parameter and, if relevant, the parameter definition. In addition, if relevant, define the frequency and term. |
To delete an existing time series:
| 1. | In the Historical Analysis page in Section 1 check the time series you want to delete. |
| 2. | Click the Remove Line button. All checked time series in Section 1 are deleted. |
|
|
If the time series is used in a correlation definition, the system warns you before deleting it. |